As one of the cornerstones upon which Classical scholarship has been built, much has already been said about Marcus Tullius Cicero. He has a sizable extant corpus that contains different genres, which in turn vary in style and topic. Furthermore, Cicero was a prominent political figure when the Roman Republic was falling and the Caesars were rising. Because of the nature of his corpus and the man himself, Cicero is an attractive topic of research not only for the traditional scholar but for a digital humanist as well. His large and varied corpus is promising for distant reading techniques, which allow us to examine and explore all of his works, thereby all of Cicero, easily and quickly. Through those digital techniques, we can gain a more complete view of who this ancient Roman man was.
I did just that in my dissertation, directed by Professor Paul Dilley, which I defended this Spring 2018. I explored Cicero’s entire corpus through the software programs R and Gephi, and I performed what I call a “mesoanalysis,” since I was analyzing many works from the same author, as opposed to a “microanalysis” which concerns only a single work, or a “macroanalysis” which necessitates a very large dataset, composed of many authors. This mesoanalysis included a stylometric analysis of Cicero’s entire corpus, a sentiment analysis of his orations, and a network analysis of his letters. For the first two parts of the dissertation, I relied on the open-source statistics program R. The stylometric analysis quantified the most frequent words (MFW) of every work and then arranged the works on a dendogram, a tree-like visualization according to various measures of distance between works, in turn based on the MFW of each. With this technique, I explored the relationships between the genres and the differences within the genre of oratory more specifically.
.png)
Figure 1: Interface for the "Digital Cicero" network within BAM.
The sentiment analysis of Cicero’s speeches was the crux of my dissertation. This analysis mapped Cicero’s use of positive and negative words throughout an oration in order to find typical trajectories of sentiment that he employed in his speeches. For this analysis, I had to create a lexicon which directed the computer to score a word as either positive or negative. I built this lexicon with words that I collected from Cicero’s corpus. I ranked those words on a scale from -3 to +3 based on the Stoic theory of emotion and modern social-psychological theories of ancient emotions (i.e. Robert Kaster’s emotional scripts). When the lexicon was complete, I carried out the sentiment analysis of the speeches, following Matthew Jockers’ work with novels as a model. At the end of the analysis, I found nine typical trajectories of sentiment for his fifty-two speeches.
The part of my dissertation that has been published as a module of Big Ancient Mediterranean is my network analysis of Cicero’s letters. This analysis is based on data collected from Epistulae ad Familiares, the corpus of Cicero’s letters to his family, friends, and acquaintances. This collection contains over four hundred letters that have traditionally been divided into sixteen books. These letters span across the years 62 BCE to 43 BCE, from just before Cicero’s consulship to moments before his death. In addition to keeping track of who corresponded with Cicero and when, I also recorded the locations from which the letters were sent and where they were received. I also noted every person mentioned explicitly or through context and places (or nationalities) named in all of the letters. I even attempted to categorize some names as literary or historical references, on the one hand, or personal acquaintances, on the other; and by social status, e.g. as freedpeople or slaves.
I am still in the process of determining what data to collect and how best to present it. I am currently collaborating with Ed Keogh, a Classics graduate student at the University of Iowa. I conducted my research by using a desktop application (RStudio), and Ed, who programs in Javascript, is helping to make my data more coherent and interactive as online visualizations. We are also making visualizations from this dataset for BAM that shows who Cicero mentioned in his letters and the social status of those people. In the future, I anticipate incorporating a chronological and geographical dimension to these visualizations.
In my dissertation I created a few visualizations of Cicero’s epistolary network through Gephi, similar to figure 1 in this post; however, figure 1 is a static image of that network, and Cicero’s node had been highlighted in order to show the directionality of the interactions. This network tracks the letters shared between Cicero and his peers within the collection. The result is an ego network of a hub-and-spoke shape Each person is represented by a node in the graph; the thickness of the lines indicates how many letters were sent from one person to another. The color shows direction. The red lines represent letters sent from Cicero to his peers, and the blue lines are the letters that he received.
.png)
Figure 2: The Network of Cicero and his Correspondents with Colored Edges
At a quick glance, we are able to see who Cicero wrote to the most in his collection: Tiro (his scribe), Terentia (his wife), C. Trebatius Testa (a close friend), S. Sulpicius Rufus (an old friend and “schoolmate”), and C. Cassius Longinus (the assassin of Julius Caesar who grew closer to Cicero in the last years of their lives). We can also see easily who wrote the most to him in the collection, namely M. Caelius Rufus whose letters to Cicero take up an entire book in the ad Familiares (Book 8).
While this graph was static in both the computer file and printed version of my dissertation, it has been given new life through BAM and has become much easier to read and manipulate. Through the interface on Digital Cicero, one can click on any node within the graph and a side menu will slide into view on the right. This menu will give you the person’s name, the statistics relating to his/her node, who is connected with him/her, and group members. Most of the nodes will have an “Incoming Connections” of 1, which means that they have only received letters from Cicero. The size of their node will indicate how many letters that they received from him. If the node has a “Total Connections” of 2 with only Cicero listed under “Connections,” then this correspondent had sent letters back to the orator. The nodes have also been divided into three groups. Most of the nodes fall into Group 0, and those that do not have corresponded with a person or group which Cicero had not. Interestingly, the Epistulae ad Familiares do include letters that are neither from Cicero nor to Cicero. Groups 1 and 2 (shown in orange and green in the network map) show those instances. For example, there is a letter addressed to Marcus Antonius from Cassius Longinus and M. Junius Brutus. That interaction is categorized into Group 2.
Furthermore, when you click on a node, that node and the ones immediately connected to it are highlighted within the graph so that you can explore these connections more easily. It will also tell you the “weighted in-degree,” which represents how many letters that correspondent received. However, in some cases when letters are co-authored, this number could be doubled, as is the case with Marcus Antonius, who received two co-authored letters from Brutus and Cassius. On the left side of the page is another menu that allows you to search for a particular person within the graph and view the data that underlines the network graph. If you are familiar with Cicero and his peers, searching through the network by using that menu would be a good place to start.
This ego-network appears to be basic. That’s because it is. As it is now, it’s only showing base-level information. However, when you incorporate more information into the visualization, it evolves and becomes more useful. That is what I did in my dissertation. I had taken this simple network graph and combined it with my work with sentiment, scoring the letters in the ad Familiares by using the same sentiment lexicon that I had used for the orations, but instead of mapping out the trajectory of sentiment in the letters, I applied the sentiment scores to the nodes in the network. Now one can see how positive or negative Cicero was in his letter to a particular person. I represented the sentiment scores with a spectrum of color, blues for low scores and reds for high. The grey nodes did not receive a letter from Cicero. As you can see, most of the nodes are in shades of blue or green. That is because of the range of sentiment scores, which went from -14 (Unknown Titius) to 470 (P. Lentulus Spinther). The average sentiment score was 73.44318, the mode was 17, and the median was 37. Overall, Cicero’s sentiment scores in the letters tended to be on the lower side.
The graph below is also one of my projects with Ed Keogh. It will be available as a dynamic, and improved, visualization on BAM in the future. A demo of that network is available here.
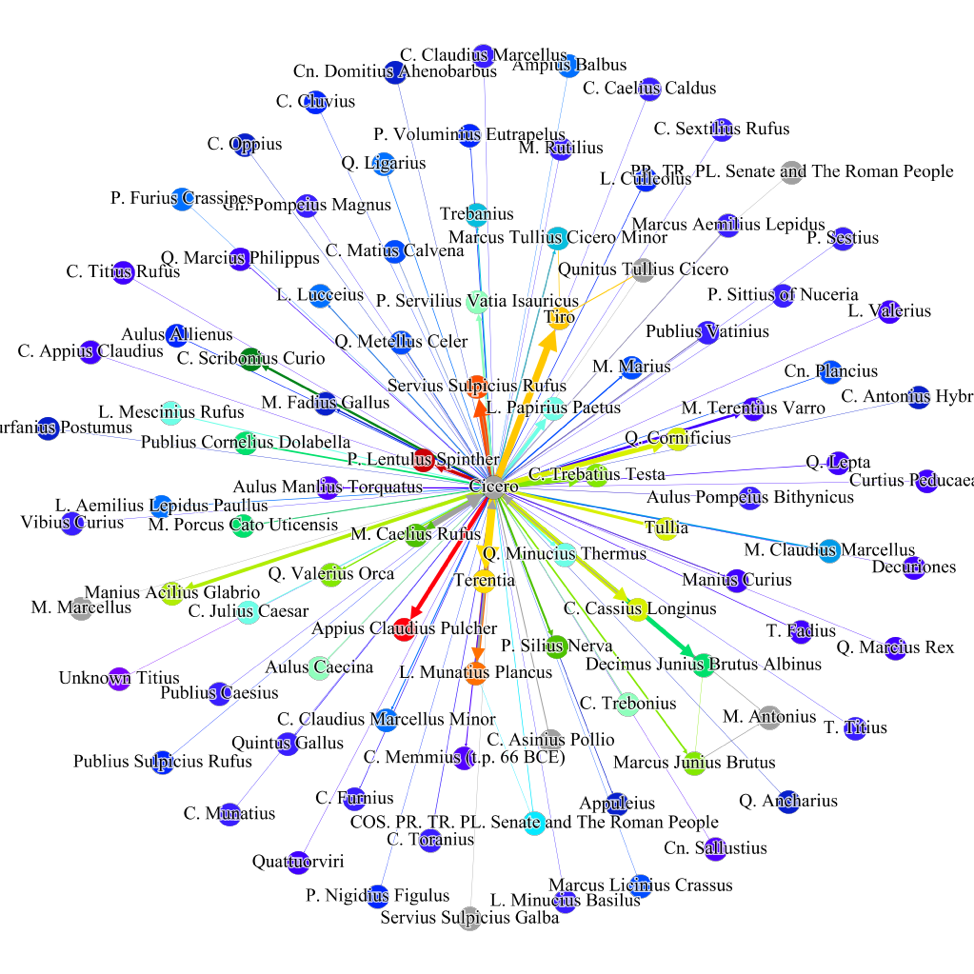
Figure 3: The Network of Cicero and his Correspondents with Sentiment
While my first network on Digital Cicero is simple, it is a starting point, both for your study and for the publication of my research. This network can be a valuable tool for quickly familiarizing yourself with the Epistulae ad Familiares and Cicero’s peers. You can easily see who his prominent correspondents were and discover the minor characters of the Late Roman Republic. In addition to my digital projects, I am also preparing my thesis as a traditional monograph. In the meantime, I wanted to share my data and research digitally, untraditionally, and conveniently. These visualizations present Cicero and his works in a different and dynamic way which I hope will allow readers to ponder not only the content of Cicero's letters, but how letters (or perhaps now emails) can be used to illustrate the networks of people we rely on every day.
Prof. Marley will be presenting some of her digital work on Cicero along with many other digital humanists at the "Ancient MakerSpaces: Digital Tools for Classical Scholarship" panel at the SCS' annual meeting in San Diego on January 5, 2019. For the full program, click here.

